5.2. Creating New Features
OpenLayers provides controls for drawing and modifying vector features. The OpenLayers.Control.DrawFeature control can be used in conjunction with an OpenLayers.Handler.Point, an OpenLayers.Handler.Path, or an OpenLayers.Handler.Polygon instance to draw points, lines, polygons, and their multi-part counterparts. The OpenLayers.Control.ModifyFeature control can be used to allow modification of geometries for existing features.
In this section, we’ll add a control to the map for drawing new polygon features. As with the other examples in this workshop, this is not supposed to be a complete working application–as it does not allow editing of attributes or saving of changes. We’ll take a look at persistence in the next section.
Tasks
We’ll start with a working example that displays building footprints in a vector layer over a base layer. Open your text editor and save the following as
map.htmlin the root of your workshop directory:<!DOCTYPE html> <html> <head> <title>My Map</title> <link rel="stylesheet" href="openlayers/theme/default/style.css" type="text/css"> <style> #map-id { width: 512px; height: 256px; } #scaleline-id { margin: 10px; font-size: xx-small; } #output-id { margin: 10px 220px; } </style> <script src="openlayers/lib/OpenLayers.js"></script> </head> <body> <h1>My Map</h1> <div id="map-id"></div> <script> var nyc = new OpenLayers.Bounds( -74.032, 40.685, -73.902, 40.876 ); var map = new OpenLayers.Map("map-id", { projection: new OpenLayers.Projection("EPSG:4326"), maxExtent: nyc, restrictedExtent: nyc, maxResolution: 0.0005, numZoomLevels: 5 }); var base = new OpenLayers.Layer.WMS( "New York City", "/geoserver/wms", {layers: "tiger-ny"} ); map.addLayer(base); var center = new OpenLayers.LonLat( -73.987, 40.737); map.setCenter(center,3); var landmarks = new OpenLayers.Layer.Vector("NY Landmarks", { strategies: [new OpenLayers.Strategy.BBOX()], protocol: new OpenLayers.Protocol.WFS({ version: "1.1.0", url: "/geoserver/wfs", featureType: "poly_landmarks", featureNS: "http://www.census.gov", srsName: "EPSG:4326" }) }); map.addLayer(landmarks); </script> </body> </html>
Open this
map.htmlexample in your browser to confirm that landmarks are displayed over the base layer: http://localhost:8082/ol_workshop/map.htmlTo this example, we’ll be adding a control to draw features. In order that users can also navigate with the mouse, we don’t want this control to be active all the time. We need to add some elements to the page that will allow for control activation and deactivation. In the
<body>of your document, add the following markup. (Placing it right after the map viewport element<div id="map-id"></div>makes sense.):<input id="toggle-id" type="checkbox"> <label for="toggle-id">draw</label>
Now we’ll create an
OpenLayers.Control.DrawFeaturecontrol to add features to the landmarks layer. We construct this layer with anOpenLayers.Handler.Polygonto allow drawing of polygons. In your map initialization code, add the following somewhere after the creation of thelandmarkslayer:var draw = new OpenLayers.Control.DrawFeature( landmarks, OpenLayers.Handler.Polygon ); map.addControl(draw);
Finally, we’ll add behavior to the
<input>element in order to activate and deactivate the draw control when the user clicks the checkbox. We’ll also call thetogglefunction when the page loads to synchronize the checkbox and control states. Add the following to your map initialization code:function toggle() { if (document.getElementById("toggle-id").checked) { draw.activate(); } else { draw.deactivate(); } } document.getElementById("toggle-id").onclick = toggle; toggle();
Save your changes and reload
map.htmlin your browser: http://localhost:8082/ol_workshop/map.html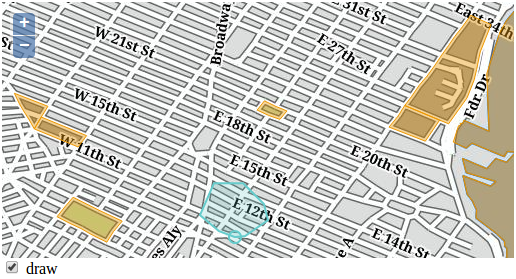
A control for adding features to a vector layer.